機械学習では学習用に多くのデータを用意する必要がありますが、画像データを公開しているサイトの一つにCIFAR-10というものがあります。
ここには32×32サイズの画像データが60,000件あります。
画像は10種類のカテゴリ(飛行機、乗り物、鳥、猫、鹿、犬、蛙、馬、船、トラック)に分けられており、それぞれに対して6,000件ずつの画像データが存在します。
ダウンロードできるデータには、”python version”, “Matlab version”, “binary version”の3種類ありますが、今回はpython versionを試しに読み込み・表示してみたいと思います。
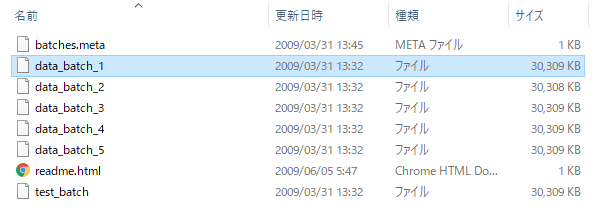
ダウンロードしたファイルを解凍したデータはこのようなもの。data_batch_1からdata_batch_5までが実際のデータ(およびラベル)になります。

読み込み方法としては、CIFAR-10のサイトには以下の様に表示されています。
The archive contains the files data_batch_1, data_batch_2, …, data_batch_5, as well as test_batch. Each of these files is a Python “pickled” object produced with cPickle. Here is a python2 routine which will open such a file and return a dictionary:
def unpickle(file):
    import cPickle
    with open(file, 'rb') as fo:
        dict = cPickle.load(fo)
    return dict
And a python3 version:
def unpickle(file):
    import pickle
    with open(file, 'rb') as fo:
        dict = pickle.load(fo, encoding='bytes')
    return dict
Loaded in this way, each of the batch files contains a dictionary with the following elements:
- data — a 10000×3072 numpy array of uint8s. Each row of the array stores a 32×32 colour image. The first 1024 entries contain the red channel values, the next 1024 the green, and the final 1024 the blue. The image is stored in row-major order, so that the first 32 entries of the array are the red channel values of the first row of the image.
- labels — a list of 10000 numbers in the range 0-9. The number at index i indicates the label of the ith image in the array data.
使用環境はpython3なので、後者のサンプルコードを使用して読み込みます。
取得できたデータは辞書形式で、’label’と’data’に分かれているので、画像とそれが何であるかを知るには両方取得する必要があります。
下記のコードで1件目のデータを取得してみます。
import numpy as np
import matplotlib.pyplot as plt

def unpickle(file):
    import pickle
    with open(file, 'rb') as fo:
        dict = pickle.load(fo, encoding='bytes')
    return dict

dict = unpickle('data_batch_1')

#1番目のラベルを表示する
print(dict[b'labels'][0])

#1番目の画像を表示する
array = np.array(dict[b'data'])[0]
img = np.rollaxis(np.reshape(array, (3,32,32)), 0, 3)
plt.imshow(img)
plt.show()
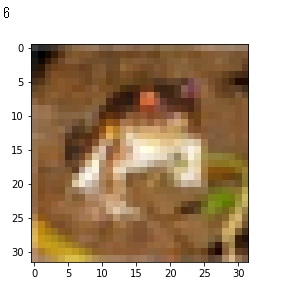
表示された内容はこちら。

画像サイズが32×32とごく小さなものなので、一見しただけでは何かわかりませんが、表示されたラベル「6」によると、これは「蛙」を意味するようです。

